Significant Fluctuations in Market Activity Continue
Martin Sugg | 2026
The real estate market fluctuates significantly from season to season. That’s nothing new. History shows that the market peaks in spring and shifts significantly lower in winter. We’ve created some great visuals that illustrate this phenomenon. My whiz-kid daughter, Summer, has figured out how to embed a set of interactive graphs below.
These graphs actively update themselves monthly on an on-going basis. There’s also a live mortgage interest rate chart from the Federal Reserve (FRED) which updates weekly so it’s useful to see the current percentage rate without a time lag. If you’re in a hurry it only takes a couple of minutes to get an update on the local market without all the media hype.
By moving your cursor along the graph-lines you can quickly compare monthly and annual trends going back five years starting before Covid. Each of the cities have their own set of active graphs showing:
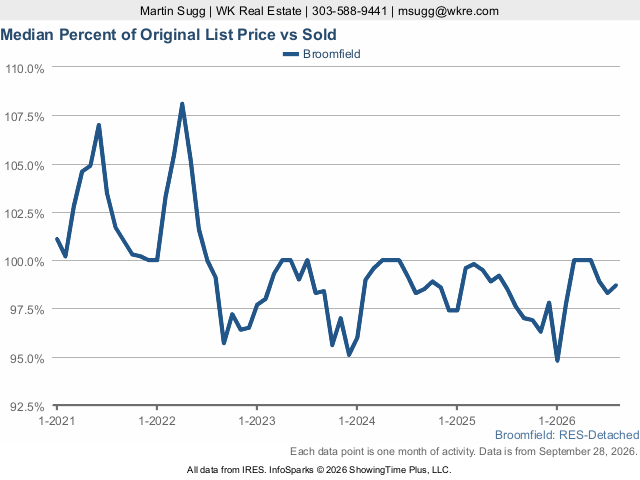
1. The percentage over or under List Price that homes are selling for (which is an indication of Seller negotiability).
2. Monthly Median Sales Price changes.
3. Monthly number of homes on the market.
4. Monthly number of homes under contract.
They are an excellent way to compare the seasonal and year-to-year fluctuations of our local real estate market. Each city is different from the others. You will get a fast and more accurate sense of what’s happening in your city (compared to reports in the media which often average entire Metro areas).
This is a great way to visually access what’s going on in real time without the month-long lag in statistics and confusing jargon the media often uses. Check it out. It’s informative and always up to date.
Live Mortgage Interest Rate Graph updated weekly.
Use your mouse to hover over the lines on the graphs to see interest rate changes. Sourced by Federal Reserve.
A look into Boulder and Denver County's statistics over a five year period that automatically updates every month.
Use your mouse to hover over the lines on the graphs to see statistics data.
Arvada:
Berthoud:
Broomfield:
Centennial:
City of Boulder:
City of Denver:
Erie:
Fort Collins:
Highlands Ranch:
Lafayette:
Lakewood:
Littleton:
Longmont:
Louisville:
Loveland:
Niwot:
Superior:
Westminster: